
Intro
Common operations and transformations on routes represented by a 2D line in xy space
Route is designed to provide many of the common route operations and transformations to make route processing simpler and quicker.
A route is represented by a series of point coordinates on a two dimensional x-y plane. Z-axis data can be specified as well, however the primary focus of these common transformations are based on the x-y plane data with z-axis data being transformed accordingly.
The primary focus is on x-y plane data because z-axis data does not have to represent a path through three dimensional space, rather z-data can represent additonal layers of route data that correspond to the x-y path.
For example, a runner may be tracking pace or heartrate, a car will have changes in speed, etc. Therefore, transformations are primarily concerned with the x-y route taken.
Installation
pip install routely
Quick start
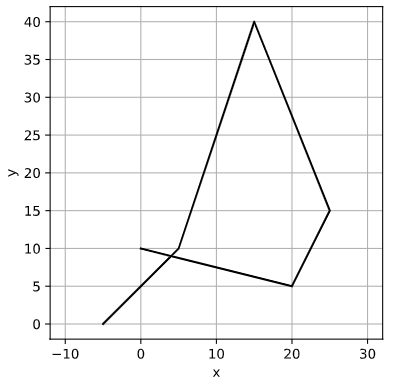
To begin with, let’s define a path that comprises two lists of x and y points that together form the coordinates of the line.
# x and y coordinates of a path.
x = [-5, 5, 15, 25, 20, 0]
y = [0, 10, 40, 15, 5, 20]
To make use of Routely, we can pass these lists of x and y points to Routely’s Route class.
from routely import Route

r = Route(x, y)

# Plot x vs y
r.plotroute()
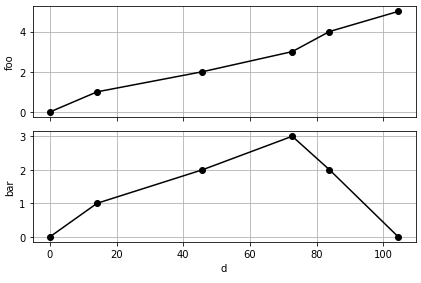
You can add z-axis data too, which should be passed as a dictionary. This enables you to have one or more z-axis datasets.
# Add a few z-axis datasets
z1 = [0, 1, 2, 3, 4, 5]
z2 = [0, 1, 2, 3, 2, 0]

# z-axis data must be passed as a dictionary
z_data = {'foo':z1, 'bar':z2}

r = Route(x, y, z=z_data)

# Plot z-axis data
# Note that z-axis data is plotted against the distance along the route
r.plot_z()
Using the Route object, you can now quickly and easily get key properties of the route data such as:
# Get the bounding box and center coordinates of the route
r.bbox()
((-5, 0), (25, 40))

r.center()
(10.0, 20.0)

# The absolute width, height and centerof the route
r.width()
30

r.height()
40