Usage
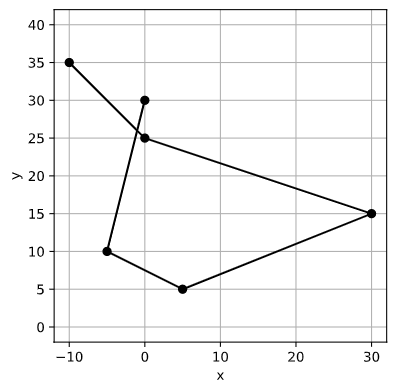
To get started, some example usage is given below. For these examples, a simple route is defined as:
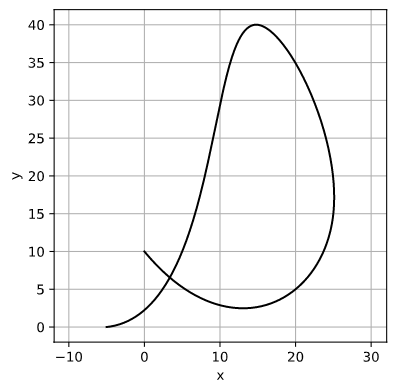
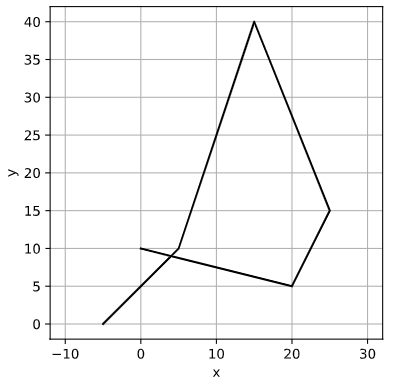
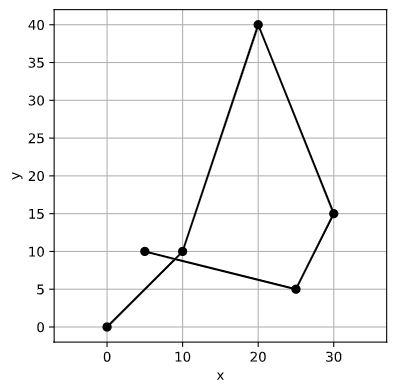
# Route x and y coordinates and corresponding z-data
x = [-5, 5, 15, 25, 20, 0]
y = [0, 10, 40, 15, 5, 10]
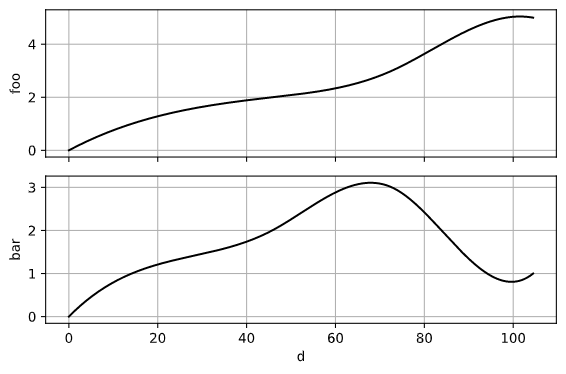
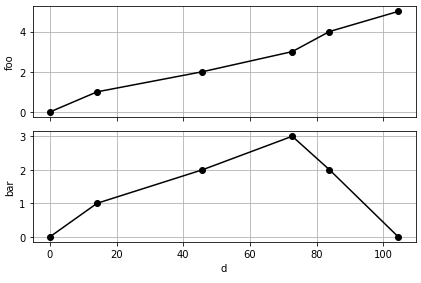
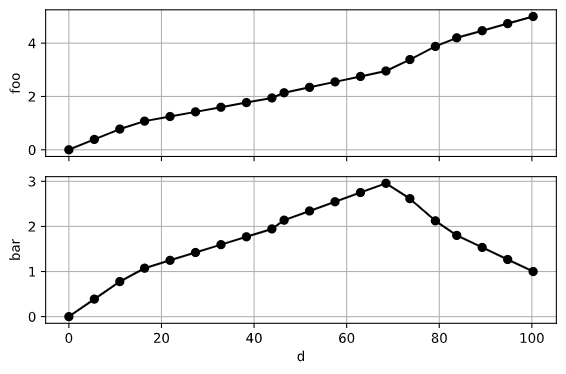
z1 = [0, 1, 2, 3, 4, 5] # foo
z2 = [0, 1, 2, 3, 2, 1] # bar
z_data = {'foo':z1, 'bar':z2}
# These are passed to Route
r = Route(x, y, z=z_data)
# Plotting x, y and z looks like this
r.plotroute()
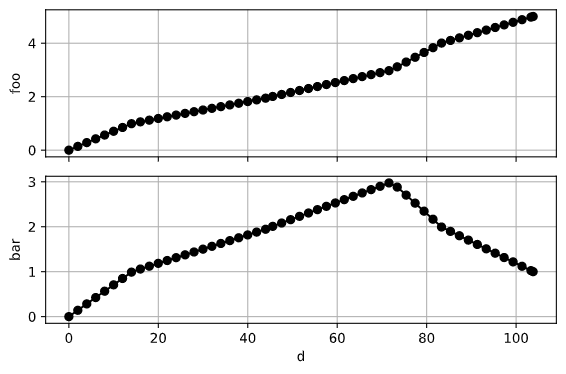
r.plot_z()
Common transformation
Translating to origin
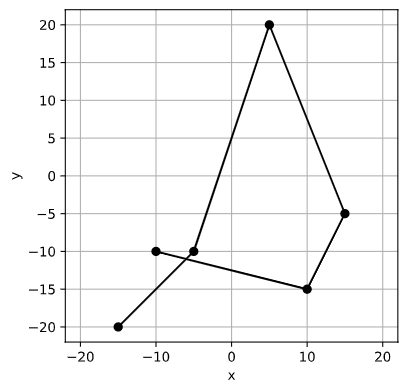
Translate the whole route so that the center coordinate point is now the origin (0, 0).
r2 = r.center_on_origin()

# Check the center point coordiates
r2.center()
(0.0, 0.0)

r2.plotroute()
Aligning to origin
Translate the route to the origin such that a specified corner of the route aligns with the origin (0, 0).
r2 = r.align_to_origin(align_corner='bottomleft')
r2.plotroute()
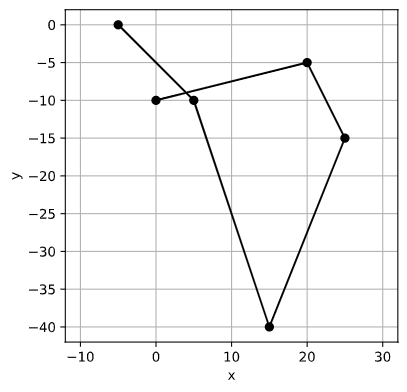
Mirror about axes
Mirror in the x direction about the route’s center point and about the x-axis.
# Mirror about x
r2 = r.mirror(about_x=True)
r2.plotroute()

# Mirror about x across the x-axis
r2 = r.mirror(about_x=True, about_axis=True)
r2.plotroute()
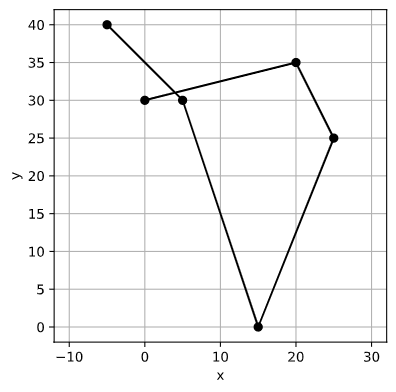
Rotating
Rotate the route by 90 degrees.
# Rotate the route through 90 degrees clockwise
r2 = r.rotate(90)
r2.plotroute()
More complex transformation
Interpolation
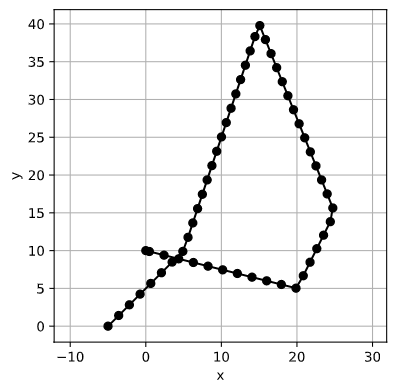
Interpolate points along the route using two methods, the first specifying the equidistant spacing between the new points, and the second specifying the total number of points to use between the start and end. The route is interpolate in the x-y plane, while the z-axis data is interpolated accordingly.
# Interpolate using equidistant steps spaced at
# equal distance of 2.
r2 = r.interpolate(kind='equidistant_steps', num=2)
r2.plotroute(markers=True)
r2.plot_z()

# Interpolate using absolute steps and specify
# a total of 20 points from start to end.
r2 = r.interpolate(kind='absolute_steps', num=20)
r2.plotroute(markers=True)
r2.plot_z()
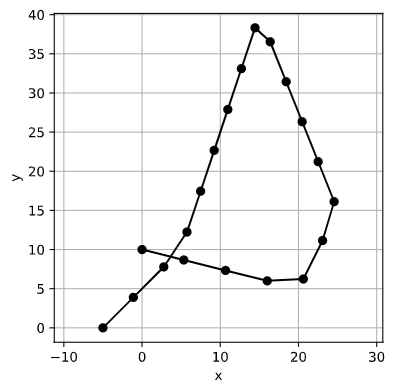
Smoothing
Smoothing the route can be done easily. It uses Scipy’s cubic interpolation function to generate a smooth curve between the existing points. The same function also applies to any z-data present for the route.
Since our example route has relatively few waypoints, no smoothing factor is needed. However, if a route has many coordiates, a smoothing factor may be needed to reduce the quantity of coordinates. The higher the smoothing factor, the fewer the points, and the smoother the route.
# Smooth the route
r2 = r.smooth()

# Since the interpolation function creates a large number of
# new waypoints, don't show the markers on the plots
r.plotroute(markers=False)
r.plot_z(markers=False)